

Why this exists
Any large language model (LLM) can describe a wildfire, a flood, or a dying forest. ASKTERRA Geospatial Agent looks at the actual satellite record and hands you the map, the chart, or the report — measured, not made up.
Sign in or create a new account.
What ASKTERRA Geospatial Agent can do that other large language models can't
A large language model (LLM) can only answer using what it already knows from its foundational training—millions of online articles, papers, forum posts, code, and similar content—or from additional tools it is given, like search or code interpreters. It can tell you what has been written about the size of a wildfire burn scar or how much Lake Mead is shrinking, but it cannot actually generate new results by analyzing data itself.
The data behind those measurements were never part of the model’s training. Decades of satellite imagery, land-cover datasets, elevation models, and agency map services exist as pixels or geographic files in specialized archives—not as words and tables on the web. No model ingested or “knows” that raw information unless it is brought in through an external tool.
Giving a model access to search engines helps, but that still only surfaces pages about the data—not the tools to analyze it directly. No search tool will open decades of Landsat imagery, clip it to your county, and measure the changes for you. Out of the box, an assistant is limited to repeating what’s already been written, or guessing.
That is the gap ASKTERRA Geospatial Agent fills. It connects the conversation to the actual data archives, performs new analysis on the current, real data, and delivers answers as an analyst would: with an interactive map, a chart you can cite, or a data-driven report you can share.
What changes
How it feels
"Show me how this forest changed from 1985 to last year." No GIS training. No code.
The agent picks the right imagery, runs the analysis, and builds the legend — against live data, not a guess.
An interactive map, a chart, a time-lapse, and/or a report. A stable link you can send to a colleague, or save for later.
What you walk away with
 Time-lapse
Great Salt Lake, four decades of Landsat
Time-lapse
Great Salt Lake, four decades of Landsat
 Fire progression
Babylon Fire, Utah: day-by-day spread
Fire progression
Babylon Fire, Utah: day-by-day spread
 Before and after
Beaver, Utah: flooding after the fire
Before and after
Beaver, Utah: flooding after the fire
 Time-lapse
Pemberton Icefield retreat
Time-lapse
Pemberton Icefield retreat
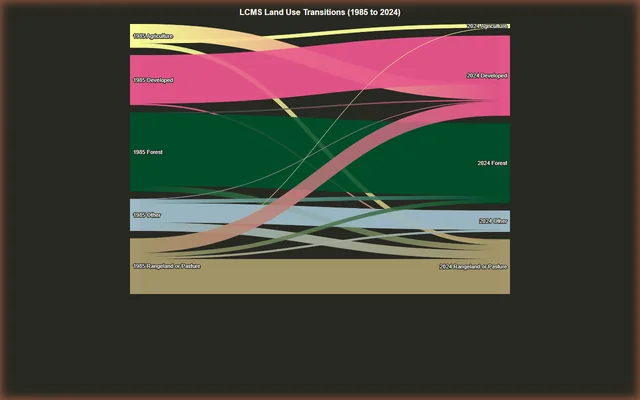 Interactive chart
Land use transitions, 1985 to 2024
Interactive chart
Land use transitions, 1985 to 2024
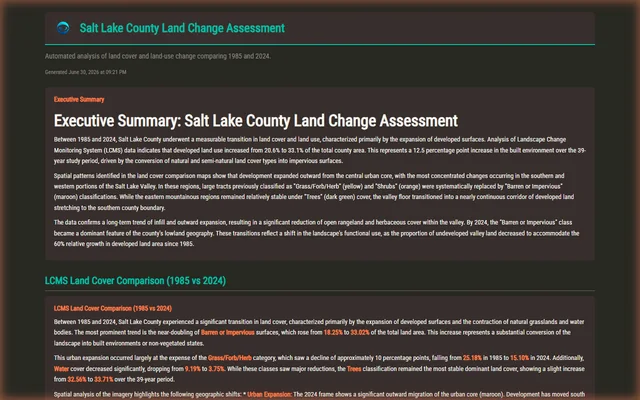 Report
Salt Lake County land change assessment
Report
Salt Lake County land change assessment
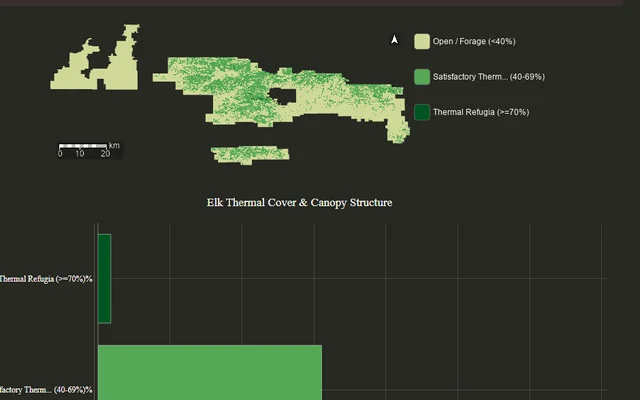 Report
Ochoco NF elk habitat: thermal cover and new forage
Report
Ochoco NF elk habitat: thermal cover and new forage
Some Example Sessions
These are real questions people have asked, lightly edited for typos. Open one to see the response.
It ran LCMS change summaries across the Southern national forests and gave two answers. The modeled southern pine beetle class peaks in 2017: on Mississippi’s Homochitto Ranger District alone, 1,354 acres of beetle mortality and 4,699 acres of salvage removal that year. The broader 1999–2002 epidemic shows up as the biggest canopy-loss spike, with about 19,900 acres of tree removal on Alabama’s Bankhead Ranger District in 2001.“Can you figure out the largest outbreak year of southern pine beetle from the LCMS Change product? I know the year but want to see if you can figure it out.”
It placed the trailhead near Creede and computed slope and aspect from 10 m USGS elevation. For the habitat map it scored every pixel on elevation (best at 9,500–11,500 ft), 15–35° escape terrain, north- and east-facing slopes, and LCMS tree and shrub cover, then grouped the scores into high, medium and low priority zones for September. Asked next, it wrote the export to a GeoTIFF that loads into onX Hunt.“Can you find the 30 Mile Trailhead in southwest Colorado and load it as a point into an interactive map for me? Also provide a slope layer and an aspect layer.”
Then“Create a classified map within a 10-mile buffer of that trailhead and identify the priority zones for mule deer habitat.”
“Read this PDF, and attempt to recreate the workflow and reports it requests. Give me the plan, but don’t execute yet.”
Then“Use a collection of allotments from the Arapaho NF, and look at the trend from 2015 to 2025.”
Your data: a PDF describing the report
It turned the PDF’s attribute guide into one Earth Engine workflow in place of the ArcGIS, CSV and R steps it described, found 92 grazing allotments on the Arapaho and Roosevelt from the Forest Service’s data warehouse, and ran the 2015–2025 trends from 30 m Rangeland Analysis Platform cover. Annual forbs and grasses fell about 3 points on the Butler, Cat and Lone Tree allotments; tree cover on Mammoth held near 48%.From annual Landsat-based LCMS land cover it mapped the lake in 1990, 2010 and 2025, with lost water in red. The water area went from about 5,100 km² in 1990 to 2,840 km² in 2025, a 44% loss, with Farmington Bay largely dry and Antelope Island now joined to the shore.“Show me changes to Great Salt Lake extent since 1990.”
Using MapBiomas Collection 9, it found 16.3 million hectares of pasture in 2014, of which 3.1 million had changed by 2023 and 2.2 million went to agriculture. The biggest destinations were mixed agriculture-and-pasture mosaic (1.36 million ha), soybean (609,000 ha) and sugar cane (132,000 ha), with a map and a full class table.“Can you estimate the departures from pasture to other agricultural classes for the state of Goiás, Brazil, between 2014 and 2023?”
It mapped burn severity from Sentinel-2 (late July against late August 2026) and slope from 10 m elevation, then combined them into a mudslide risk index. Across Spokane County, about 3,700 acres scored moderate, 156 high and 5 extreme, all on steep, severely burned canyon walls. Low-risk ground is left transparent so the hot spots stand out on the map.“Help me model the slope stability and mudslide risk from the Aug 2026 Spokane fires.”
It weighted summer surface temperature from Landsat (40%), tree-canopy deficit from NLCD 2023 (35%) and a vegetation deficit from NDVI (25%) across developed land. About 62,000 acres scored very high priority, concentrated in Rose Park, Glendale and Poplar Grove on the west side of Salt Lake City and in West Valley City, with the Jordan River corridor as a natural spine for new parks.“Do a suitability analysis for a new public park in the Salt Lake Valley. Consider potential to mitigate urban heat islands and bring vegetation and water to underserved communities.”
It classed every building footprint by ground elevation from 10 m USGS data: high risk under 5 ft, moderate 5–10 ft, low 10–16.5 ft. The South Shore barrier islands and back bays stand out, including Long Beach, Fire Island, Freeport, Lindenhurst and Mastic Beach, along with low harbors on the North Shore.“Show me a risk map for Long Island where coastal flooding is most likely to impact infrastructure, homes and buildings. If you can incorporate a building footprint layer and categorize each building by risk, that would be ideal.”
It laid out a five-step plan first, as asked. Clouds hid the optical imagery, so on the user’s call it switched to Sentinel-1 radar: it flagged clearing where backscatter dropped more than 3.5 dB between 2020 and 2025, picked out water-filled pits, dropped patches under about 0.8 ha, and mapped the result with area charting turned on.“Create a workflow to monitor illegal mining in Peru. Present the outline before proceeding.”
Then“I can see change in the SAR layers. Use those for the change detection.”
Make it yours
ASKTERRA Geospatial Agent is one version. If you want to use it for your own organization, we can build a version for you. What you're using right now is the ASKTERRA deployment, run by RedCastle Resources. If you would like a customized version, with your own tools, branding, styling, and/or data sources, we can work with you to create a custom deployment.

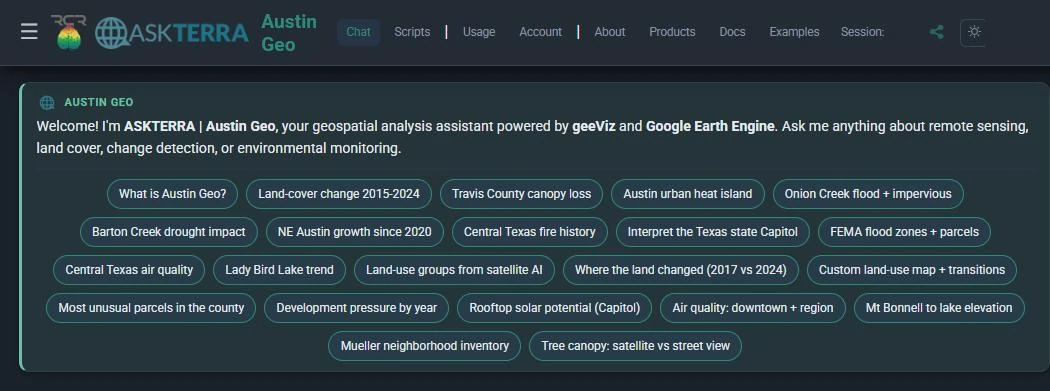
Logo, colors, and language that match the rest of how you show up.
Starter prompts and tools aimed at the work your team already does.
Who can sign in. Who can see which analyses. Managed like the rest of your org.
Your URL. Your deployment. Not a generic chatbot with a map pasted in.
What you want to do, who will use it, what data you already have. About 45 minutes.
Chat, a hook into an agent you already run, a branded copy, or some mix. We map that to your cases.
A staging URL with your name on it. You sign in and run real questions, not demos.
Your domain, your people, monitoring. We keep operating it.
Why you can trust the answer
Every number and every pixel came from the satellite record. No invented statistics. No fake maps.
Save the code for the analysis. Hand it to a colleague. Re-run it next season on new imagery.
The session is not a black box. You get the map, the chart, and the code that shows exactly how it was made.
Sign in or create a new account.
 geeViz
 Google Earth Engine
 Google Gemini